I Benchmarked Running AI Models Directly in the Browser. It Completely Trashed My Core Web Vitals.
CWV Edition
May 26, 2026
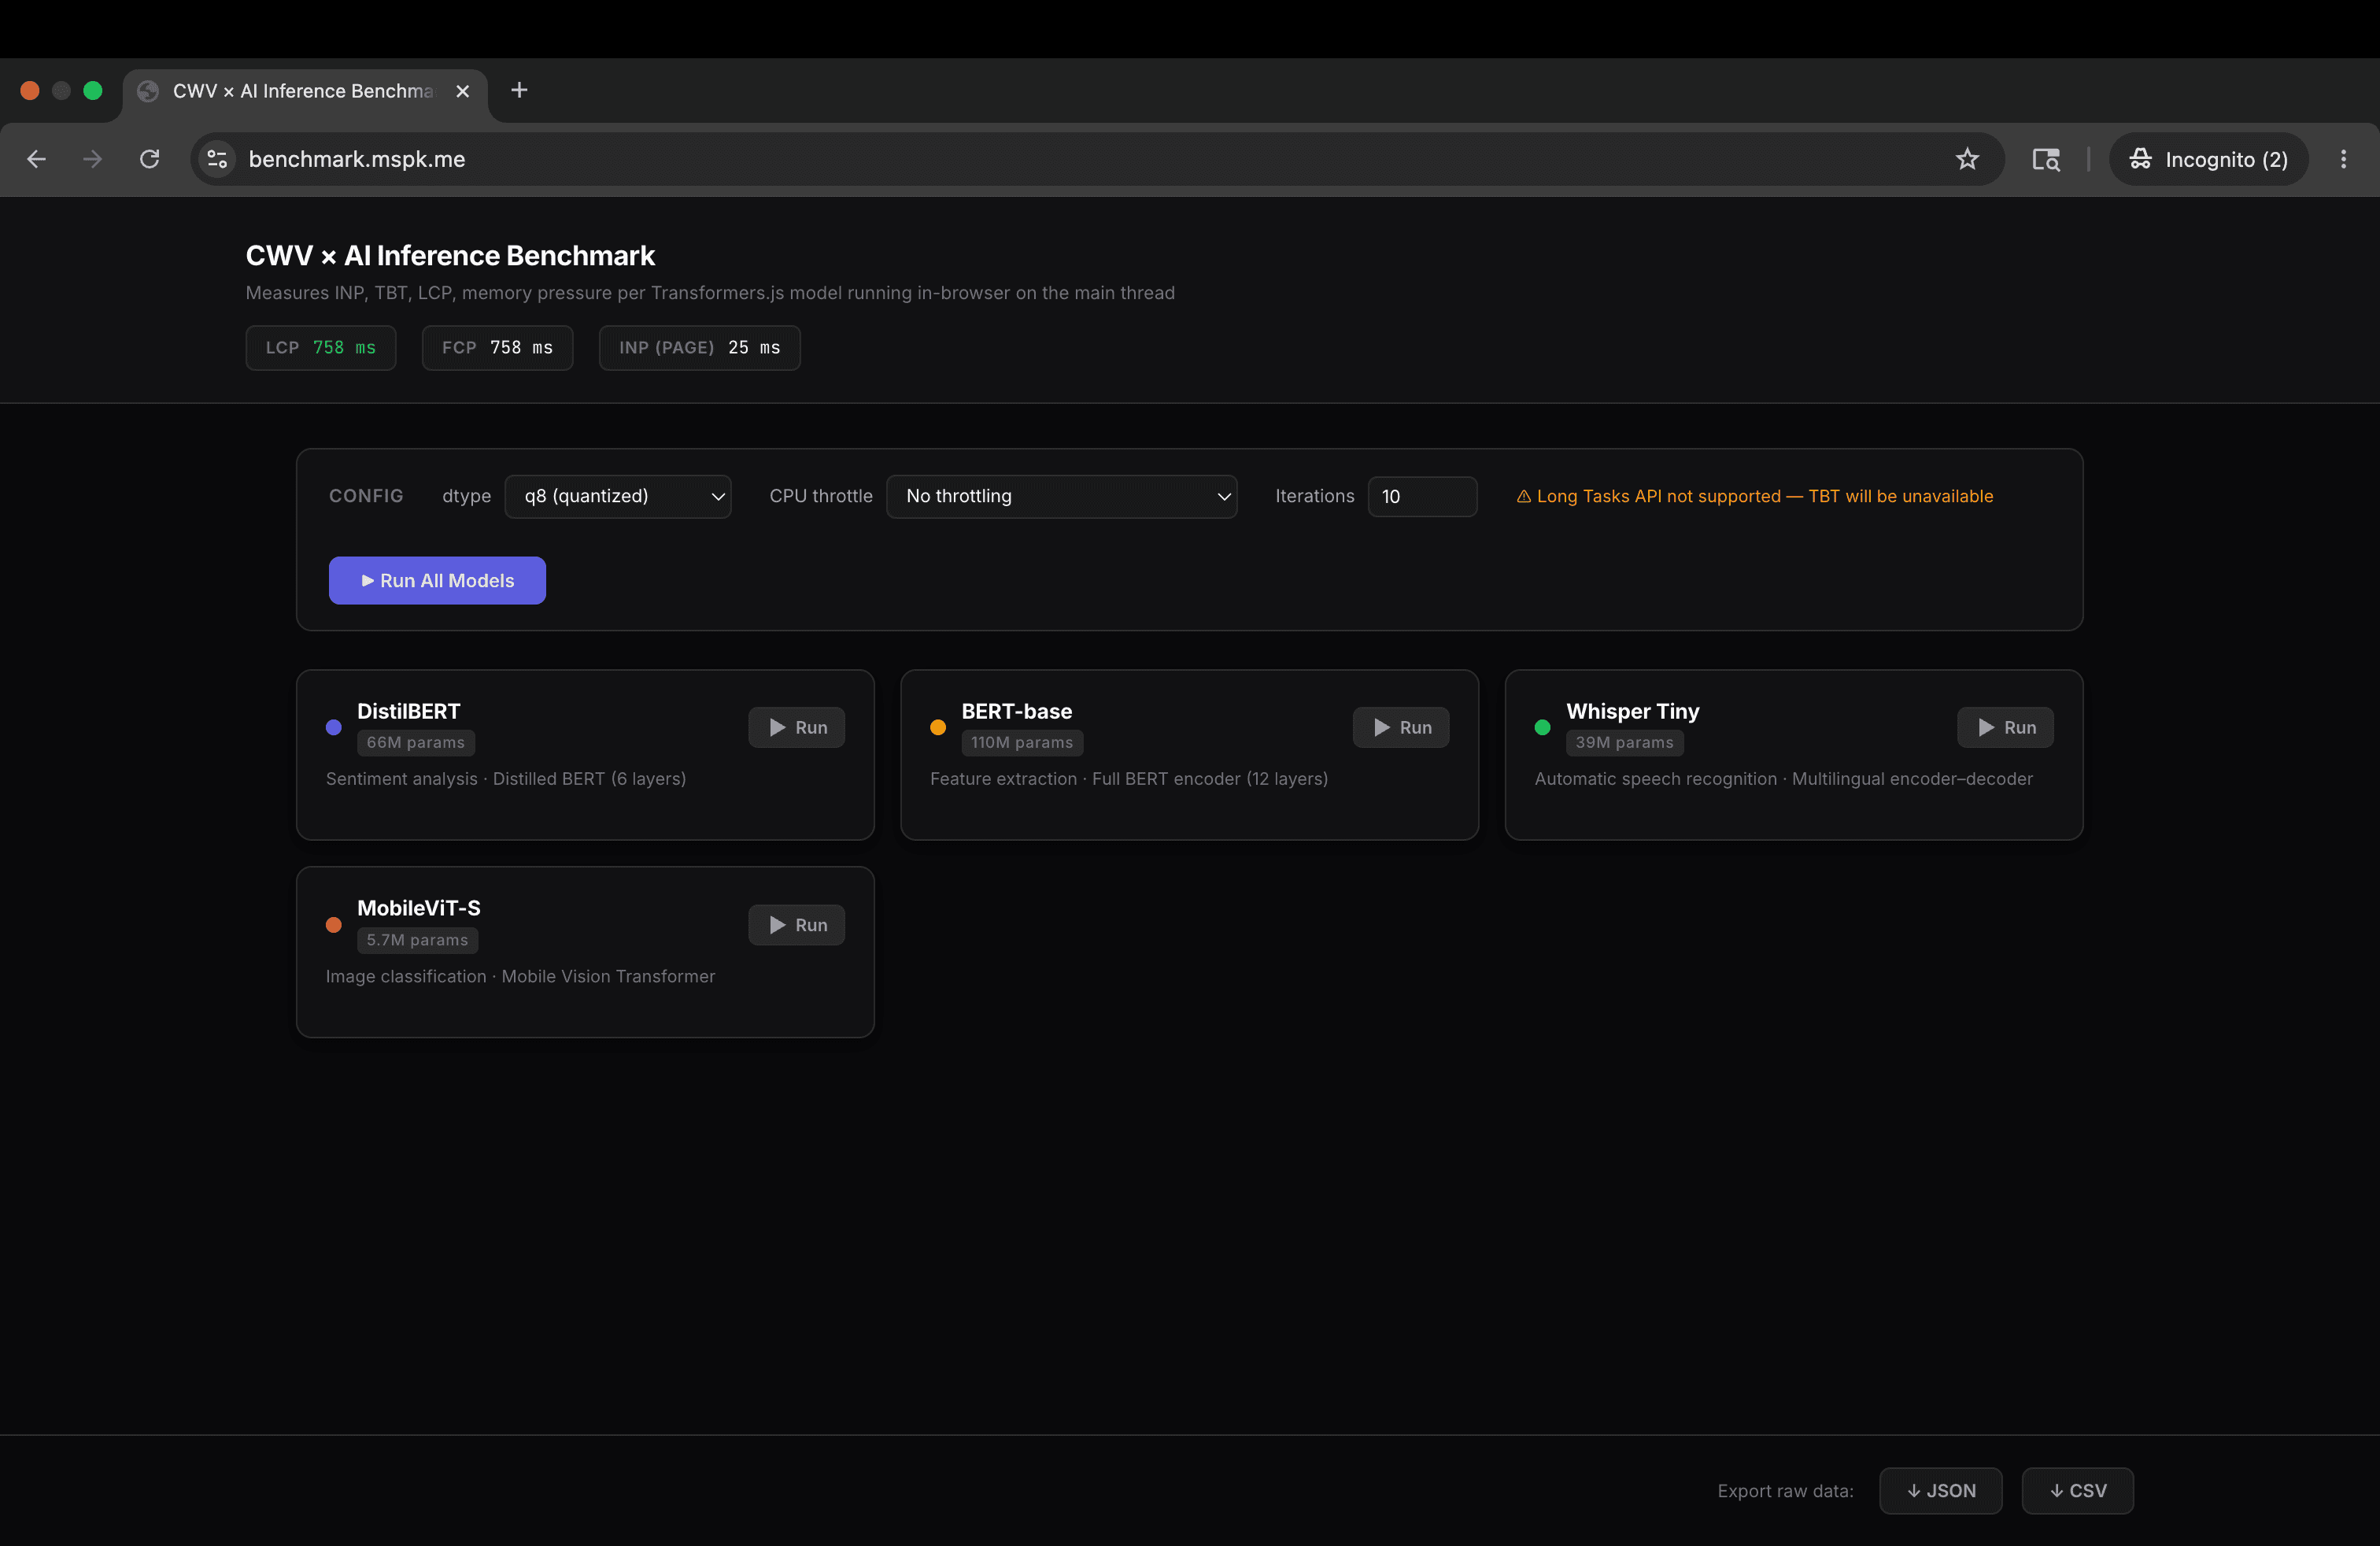
We are living in the golden age of offloading computation to the client. Frameworks are faster, edge networks are smarter, and libraries like Transformers.js have made running actual neural networks inside a browser look like a walk in the park. No API keys, no expensive server infrastructure, and zero round-trip latency. It sounds like a privacy-first, cost-free dream.
So, naturally, I decided to build a rigorous benchmark harness to measure what actually happens when you run quantized models directly on the client.
I tested four different models across real hardware (ranging from a high-end M1 Max MacBook Pro to a premium folding Android device) and simulated lower-tier mobile profiles. I tracked heap spikes, bundle sizes, and—most importantly—Interaction to Next Paint (INP).
The results were a complete reality check. If you think client-side AI is a free lunch, your search engine visibility and user experience are about to pay a massive price.
The Metric We Are Killing: INP
On March 12, 2024, Google officially swapped out First Input Delay (FID) for Interaction to Next Paint (INP) as a Core Web Vital. While FID gave you a pass if the browser handled the very first user interaction decently, INP is relentless. It tracks the latency of interactions throughout the entire lifespan of the page.
Google classifies INP using three strict buckets:
-
Good: Less than or equal to 200 ms
-
Needs Improvement: 201 ms to 499 ms
-
Poor: Greater than or equal to 500 ms
When an application triggers a neural network inference pass synchronously on the browser’s main thread, it executes a mountain of math. Because JavaScript is single-threaded, the browser cannot paint, process clicks, or handle scrolling while that math is running. The main thread completely locks up.
To isolate exactly how much damage this causes, my benchmark used a programmatic click event to trigger inference and measured the precise duration until the second subsequent requestAnimationFrame paint cycle completed. This isolated the raw cost of the AI model from other main-thread noise, giving us a conservative, lower-bound estimate of the real-world user experience.
The Cold, Hard Data
Here is what happens when you run these models on a warm cache across different devices without any CPU throttling:
The Desktop Baseline: MacBook Pro M1 Max
On an absolute beast of a machine, you would expect flawless performance. For the most part, it delivers—until you hit audio processing.
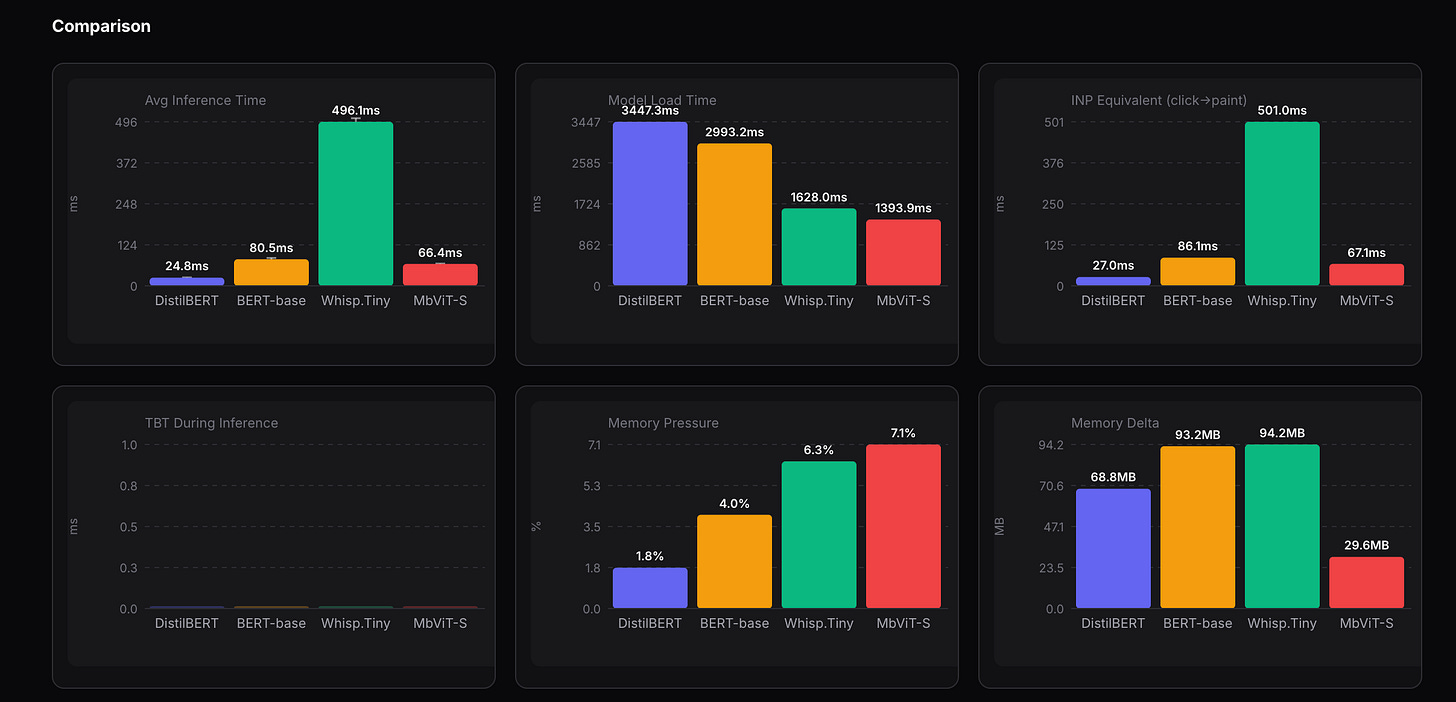
ModelTaskAvg Inference TimeMeasured INP-EquivalentGoogle UX ClassificationDistilBERT (66M)Sentiment Analysis25.7 ms27.2 msGoodBERT-base (110M)Feature Extraction82.6 ms84.1 msGoodMobileViT-S (5.7M)Image Classification65.9 ms68.0 msGoodWhisper Tiny (39M)Speech Recognition502.1 ms500.3 msPoor
On premium desktop hardware, three out of four models squeak by safely under the 200 ms “Good” threshold. But the moment you trigger Whisper Tiny to process an audio buffer, the main thread hangs for half a second—landing it squarely in the Poor category before you even factor in rendering application UI changes
The Real-World Mobile Baseline: Samsung Galaxy Z Tri Fold
Most of your users are not browsing from a maxed-out laptop. Moving the exact same unthrottled environment to a premium Android device reveals a glaring hardware penalty.
ModelAvg Inference TimeMeasured INP-EquivalentGoogle UX ClassificationDistilBERT (66M)55.2 ms57.1 msGoodBERT-base (110M)162.0 ms164.3 msGoodMobileViT-S (5.7M)155.4 ms155.4 msGoodWhisper Tiny (39M)1,215.4 ms947.4 msPoor
Across the board, we see a consistent 2x performance degradation just by shifting from a high-end laptop to high-end mobile hardware. While DistilBERT and BERT-base stay mathematically “Good,” they consume a dangerous amount of the 200 ms budget. If your app is doing literally anything else on the main thread, you risk crossing into “Needs Improvement” instantly.
Meanwhile, Whisper Tiny blows past acceptable human limits, taking nearly a full second (947.4 ms) to yield paint control back to the device.
When Things Get Ugly: Simulated Throttling
A premium, flagship phone is still the best-case mobile scenario. To see what happens in the hands of everyday users, I simulated a mid-range Android device (4x CPU throttle) and an entry-level device (6x CPU throttle).
Look at how the INP-equivalent scaling factors cascade:
-
DistilBERT scales from 57.1 ms at baseline up to 385.1 ms under 6x throttle on the phone. It completely loses its “Good” status and slips into “Needs Improvement”.
-
BERT-base hits 1,009 ms under 6x throttle—crossing deep into “Poor” territory.
-
Whisper Tiny hits a catastrophic 6,535 ms on a 6x simulated throttle.
Imagine this in production: A user interacts with your AI feature, and their entire mobile browser freezes completely for over six seconds. No animations play, links can’t be tapped, and the interface is entirely unresponsive.
The Paradox: Why Smaller Isn’t Faster
The most fascinating takeaway from this empirical data is that model size is an incredibly poor predictor of frontend performance.
Look at the specs: BERT-base has 110 million parameters. Whisper Tiny has only 39 million parameters. Yet, Whisper Tiny is consistently 6x to 10x slower and wrecks the main thread far worse than BERT.
This happens because of a massive architectural bottleneck: the autoregressive decode loop.
An encoder-only model like BERT processes inputs in parallel, generating its output in a single forward pass. An encoder-decoder model like Whisper must generate output tokens sequentially. It runs a full decoder forward pass over and over again for every single token produced. Quantization down to INT8 reduces the weight sizes on disk, but it does absolutely nothing to alter this fundamental architectural loop.
How to Save Your Site’s Performance
If you are planning to add on-device AI features to your web apps, you cannot treat them like standard utility functions. Here are the thresholds established by this benchmark:
-
The Main Thread is for UI only: Stacking even a light model like BERT-base on top of modern framework overhead risks pushing your site into Google’s penalty box.
-
The DistilBERT Ceiling: DistilBERT is the absolute highest tier of model you can safely run synchronously on premium desktop hardware without immediate degradation. On mobile, even this light model requires extreme caution.
-
Web Workers are Mandatory: If you are utilizing vision transformers or audio-processing models, you must explicitly offload the entire inference lifecycle into a dedicated Web Worker to protect UI responsiveness.
The runtime file overhead is fixed (a hefty 4.1 MB WASM asset), and the memory delta spikes can climb past 210 MB easily on local heaps. If we are going to force our users’ devices to bear that resource weight, the least we can do as engineers is keep the interface responsive while it happens.
In my next post, we’re going to look directly under the hood at the autoregressive loop to figure out why a 39M parameter model demands 5x more memory activation space than models twice its size.
The full open-source benchmark harness used for this study is available on GitHub at srikarphanikumar/cwv-ai-benchmark. You can run the live suite on your own hardware at benchmark.mspk.me. Full academic paper published on Zenodo.