How Time Slicing in Concurrent UI Architectures Improves Responsiveness
Breaking work into chunks, yielding to input, and debugging partial renders in modern UI frameworks
November 19, 2026
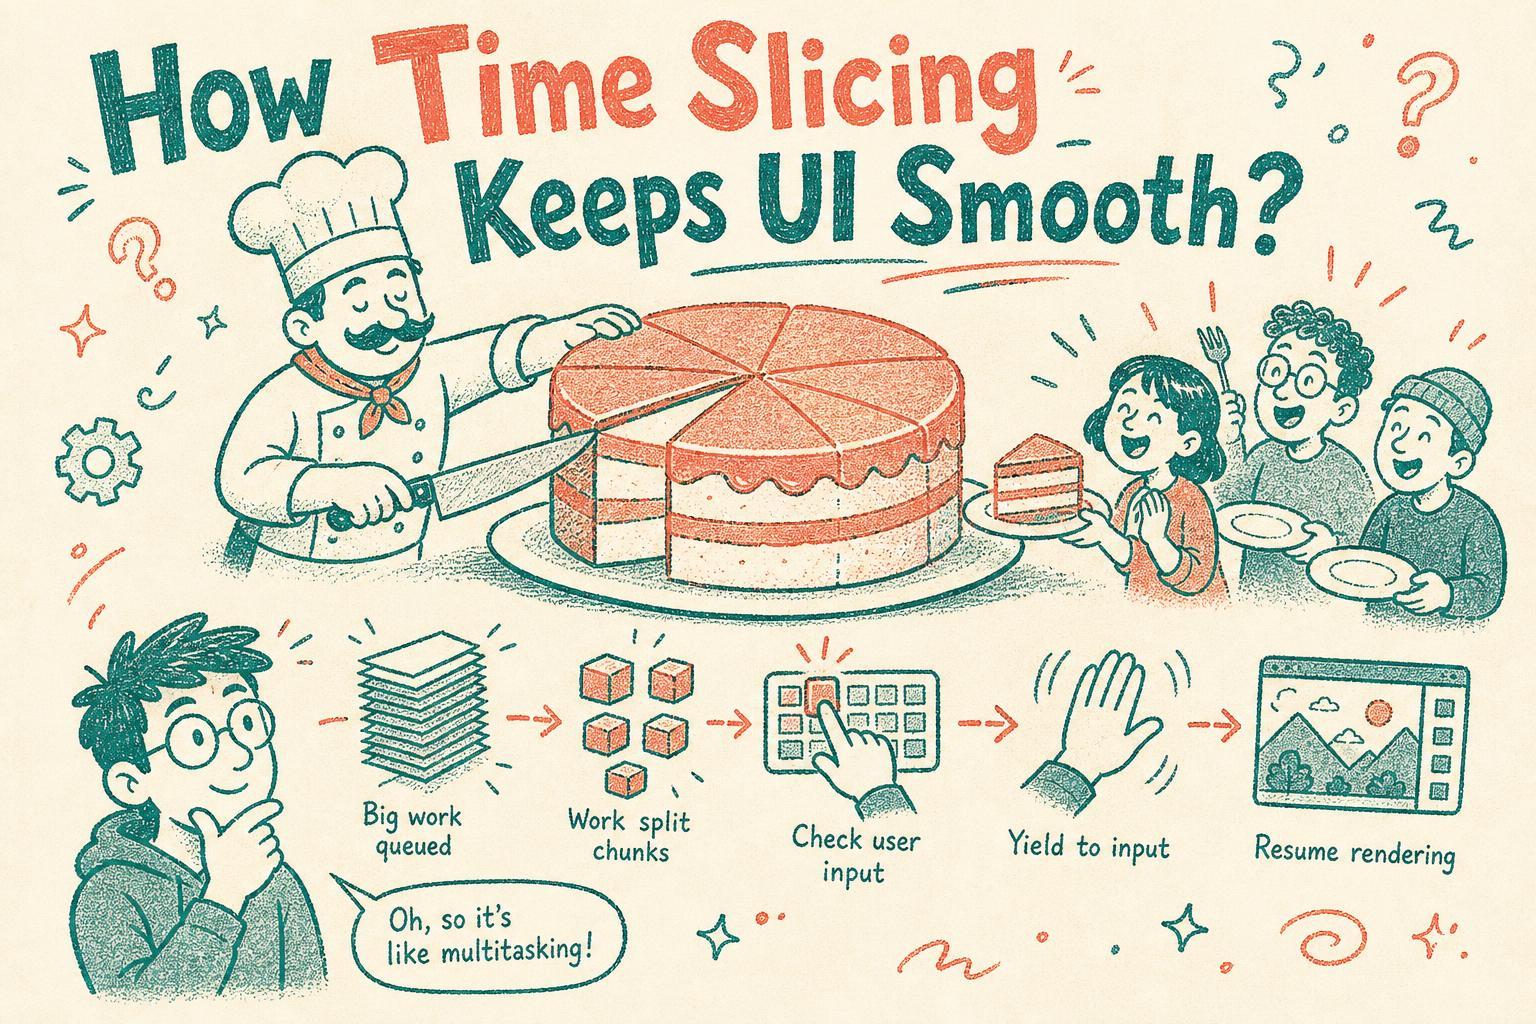
You know that moment when you scroll or type in your app and it feels sluggish? Maybe buttons don’t respond instantly, or parts of the UI flicker or partially update before settling. You wonder, “Why can’t this just stay smooth?”
I’ve been there too. The culprit often hides deep in how your framework schedules work on the main thread. That’s where time slicing in concurrent UI architectures comes in , breaking heavy work into smaller chunks and yielding control to keep the UI responsive.
Let me walk you through what time slicing really means under the hood, how schedulers decide when to pause work for user input, and some gotchas you might face when debugging partial renders or flickering UI.
When Your UI Freezes: The Classic Blocking Problem
Imagine you have a big update to render , say, a complex list or a chart with thousands of nodes. Traditionally, the browser runs JavaScript and rendering in a single thread. If your rendering task takes 100+ milliseconds straight, the browser can’t process any input events during that time.
The result? The app feels frozen. Your clicks or typing lag because the main thread is busy.
Previously, the browser had no way to interrupt or slice that work. It just had to finish before moving on.
Enter Time Slicing: Breaking Work Into Manageable Chunks
Modern frameworks like React (with Concurrent Mode), and some scheduler libraries, use time slicing to split big rendering tasks into smaller units of work, often called "fibers" or "units of work."
Instead of doing all at once, the scheduler works on a chunk, then checks if there’s higher priority stuff , usually user input , to handle. If yes, it yields control back to the browser to process that input, then resumes later.
This approach lets the UI stay interactive, even during large renders.
How Does the Scheduler Decide to Yield?
Under the hood, the scheduler uses a deadline or timer to decide how long it can work before yielding. For example, it might work for 5ms, then check:
- Has user input or animation arrived?
- Is the frame budget for rendering almost up?
If yes, it pauses the rendering work.
This is often implemented using APIs like requestIdleCallback or a custom scheduler based on MessageChannel or postMessage to queue tasks.
Prioritizing Tasks
Not all work is equal. Input events get higher priority than rendering. Network responses or logging might be lower priority.
So the scheduler maintains a queue of tasks with priorities. It ensures that urgent work like processing a user’s keystroke runs before less urgent rendering continues.
A Concrete Example: React’s Fiber Scheduler
React’s Fiber architecture is probably the best-known example.
When you update state, React splits rendering into units of work representing parts of the component tree. Each unit is small, like reconciling one component.
React’s scheduler runs these units, then checks if it should yield based on time or pending input. If so, it stops and lets the browser handle input events, then continues later.
This means your app stays responsive even during big renders.
But Why Do Partial Renders or Flickering Happen?
Time slicing can introduce subtle bugs if not handled carefully.
Partial UI States
Because rendering happens in chunks over multiple frames, you might see UI parts update before others. For example, a list might show half the new items, then the rest.
If your components rely on side effects or have inconsistent intermediate states, this partial update can cause flickering or weird glitches.
Suspense and Loading States
Frameworks use Suspense boundaries to show fallback UI during async work. Time slicing can cause these boundaries to show and hide multiple times if the scheduler yields frequently.
This can lead to flickering loaders or jumping content.
Stale Props or State
If updates are interrupted and resumed later, you might run into cases where components see stale data during the intermediate phases.
Debugging Time Slicing Issues
When you spot flickering or partial renders, here’s what I recommend:
-
Check your component’s side effects: Are you performing DOM mutations or network calls during render? That’s a no-no. Render should be pure.
-
Use React DevTools Profiler: It shows you how work is split across frames, helping you identify if time slicing causes multiple partial renders.
-
Beware of non-idempotent render logic: Rendering should produce the same output multiple times safely. If it doesn’t, partial updates can break UI.
-
Test with and without concurrent mode: Sometimes disabling concurrent features can isolate if time slicing is the cause.
How to Tune Time Slicing Behavior
Schedulers often let you tweak parameters like:
- Maximum work chunk size (how long to work before yielding)
- Priority levels for different tasks
Adjusting these can balance responsiveness versus rendering speed.
If you slice too aggressively, you get many small updates and possible flickers. If you slice too little, UI can freeze.
Wrapping Up
Time slicing in concurrent UI architectures helps keep your app responsive by breaking big work into small chunks and yielding to user input.
This scheduling dance lets rendering and interaction coexist smoothly, but it also means your UI updates happen incrementally. That can cause partial renders or flickers if your components aren’t designed for it.
Understanding how the scheduler works under the hood, prioritizes tasks, and chooses when to yield can help you debug these issues and tune your app’s responsiveness.
Next time your UI feels sluggish or flickery, you’ll know to peek beneath the surface , it’s often the scheduler slicing time to keep your app feeling alive.