AI-Powered Frontend Debugging Tools: How They Work, What They Fix, and When to Watch Out
A hands-on look at the new wave of AI assistants that peek into your frontend code and runtime to help squash bugs — and why you shouldn’t blindly trust every AI-generated fix.
September 17, 2026
Ever been stuck on a frontend bug that just wouldn’t quit? You try console.logs, step through the code, and maybe even rubber-duck your way through it. Then you hear about AI-powered debugging tools that claim to read your code, inspect live data, and suggest fixes. Sounds magical, right?
I recently took a deep dive into how these AI assistants actually work under the hood, what makes them useful, and the pitfalls that caught me off guard. Spoiler: they can speed up your debugging but can also lead you into traps if you don’t keep your wits about you.
The familiar frustration: Debugging frontend bugs is often a guessing game
Imagine you have a React app where a button click sometimes fails silently. No errors in the console, no obvious clues. You add console.logs, inspect props, trace event handlers , but the cause remains elusive.
This exact scenario is where AI debugging tools shine. They promise to analyze your code, runtime state, and sometimes even network requests to offer targeted hints or code fixes.
But how do they do it?
How AI debugging assistants peek under the hood
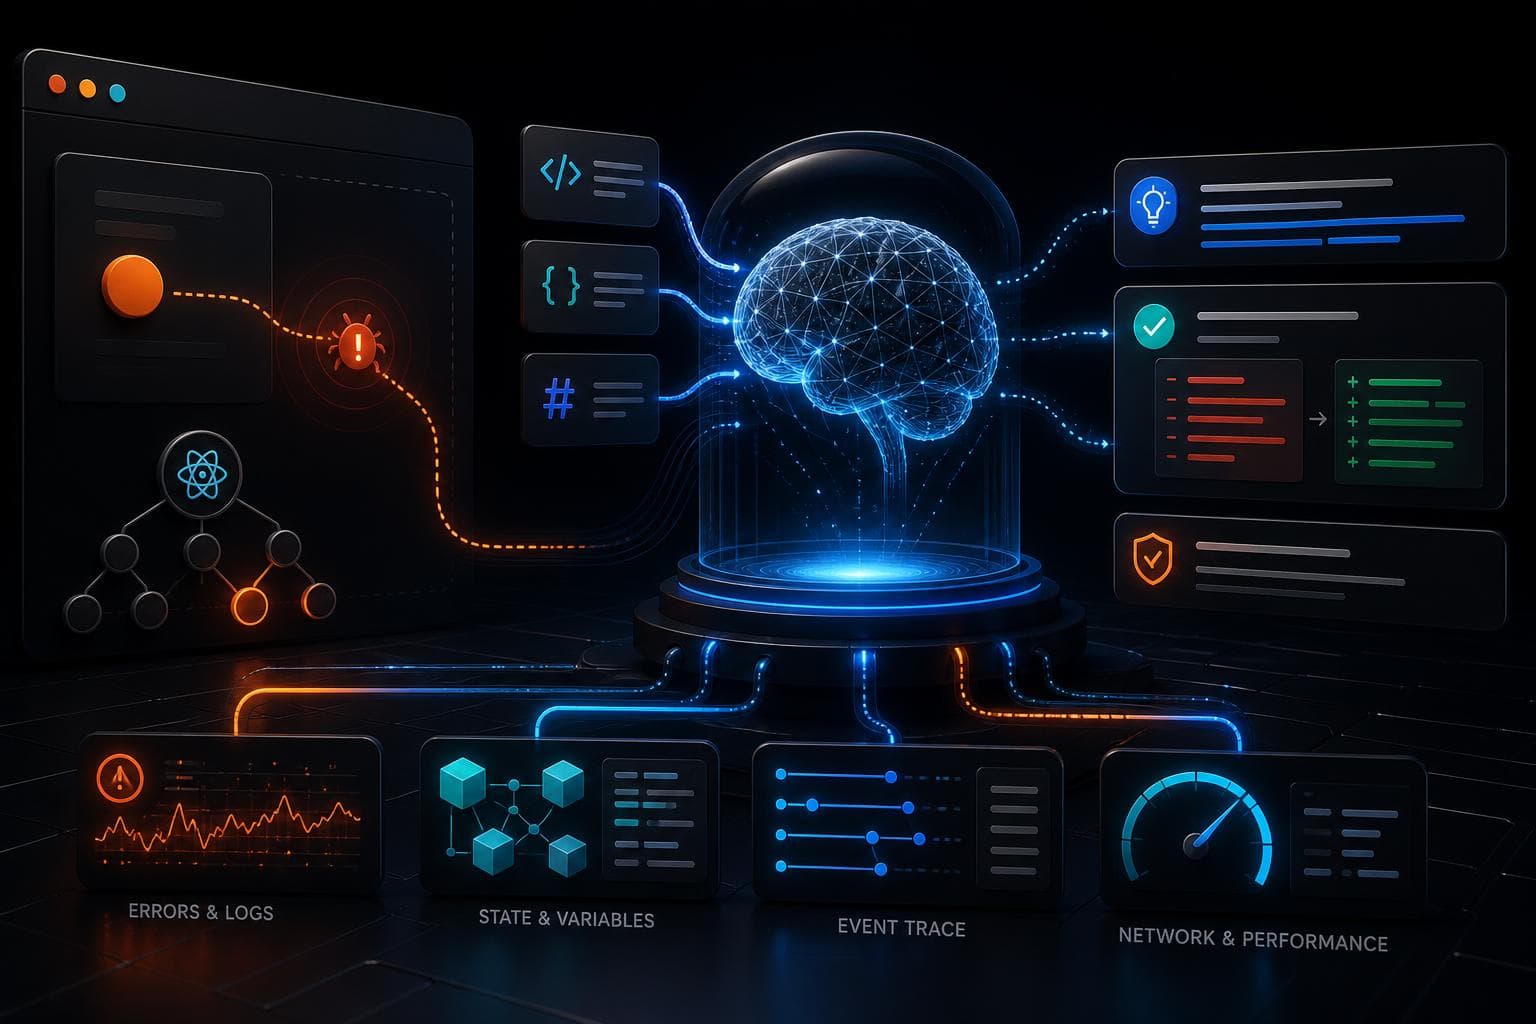
At their core, these tools combine two main things:
-
Code understanding: They parse your source files (JavaScript, JSX, CSS) to build a model of your app’s structure, functions, and data flow.
-
Runtime data analysis: They hook into your app as it runs , collecting error logs, inspecting variable values, event traces, or even performance stats.
Then they feed all this into a large language model (LLM), like GPT-4 or specialized code models, prompting it with your code snippets and runtime context.
The AI tries to figure out what the bug might be and suggests fixes or debugging steps. Some tools go further and generate patch diffs or automated tests.
Concrete example: Debugging a mysterious state update bug
I tested one tool on a React component where a state update didn’t trigger a re-render. The AI assistant:
- Parsed the component code to understand state declarations and effects.
- Looked at console logs and event handlers.
- Suggested that a state variable was mutated directly instead of replaced, causing React to skip the re-render.
The suggestion included a code snippet showing how to create a new state object instead of mutating the existing one. That was exactly the bug.
This saved me a few rounds of trial-and-error.
What makes these AI tools helpful?
- Context awareness: Unlike generic Stack Overflow searches, they see your exact code and runtime environment.
- Interactive debugging: Some let you ask follow-up questions or request code explanations.
- Speed: They can generate hypotheses faster than manual debugging.
- Learning aid: Seeing AI’s reasoning can teach you new techniques or API usages.
But watch out: AI debugging isn’t foolproof
AI models hallucinate , they sometimes confidently suggest fixes that don’t actually work or misinterpret the code context.
In one case, the assistant suggested adding a missing import that wasn’t actually missing, which would have caused a new error.
Also, many AI tools have limited visibility:
- They don’t truly run your code in a debugger, so can’t catch runtime side effects reliably.
- They may lack access to complete app state or external APIs.
- They sometimes treat symptoms, not root causes.
Blindly applying AI-generated fixes can introduce subtle bugs or security risks.
How to get the most out of AI debugging assistants
- Use their suggestions as hypotheses, not gospel truth. Always review and test.
- Combine AI insights with traditional debugging tools , breakpoints, performance profilers, network inspectors.
- Feed the AI rich context: include relevant code snippets, error messages, and runtime logs.
- Be wary of fixes that feel too good or too generic.
What this means for your developer workflow
AI debugging tools can become a handy pair of extra eyes , especially for tricky frontend bugs where code and runtime state interplay is complex.
They won’t replace your intuition or understanding but can speed up the cycle of forming and testing hypotheses.
As these tools evolve, expect tighter integration with editors, browsers, and CI pipelines, making debugging more interactive and data-driven.
Final thoughts
I’m excited about AI’s potential to tame frontend bugs, but I’m also cautious. These assistants are powerful new teammates but not omniscient gurus.
Keep your debugging skills sharp, test everything thoroughly, and use AI suggestions to supplement, not replace, your developer judgment. That’s how you’ll turn AI debugging tools from a neat novelty into a trusted part of your toolbox.